ChronoOps manages multi-cloud assets, Kubernetes, a bastion, automated jobs and on-call in one platform. When something breaks, AI can read the alerts and process samples and suggest a diagnosis. You authorize the action, then check the result.
Community: free licence, up to 50 nodes · Enterprise: private deployment
AssetsOperationsObservability and AI
Product UI · Synthetic data
Asset overview and to-do counts
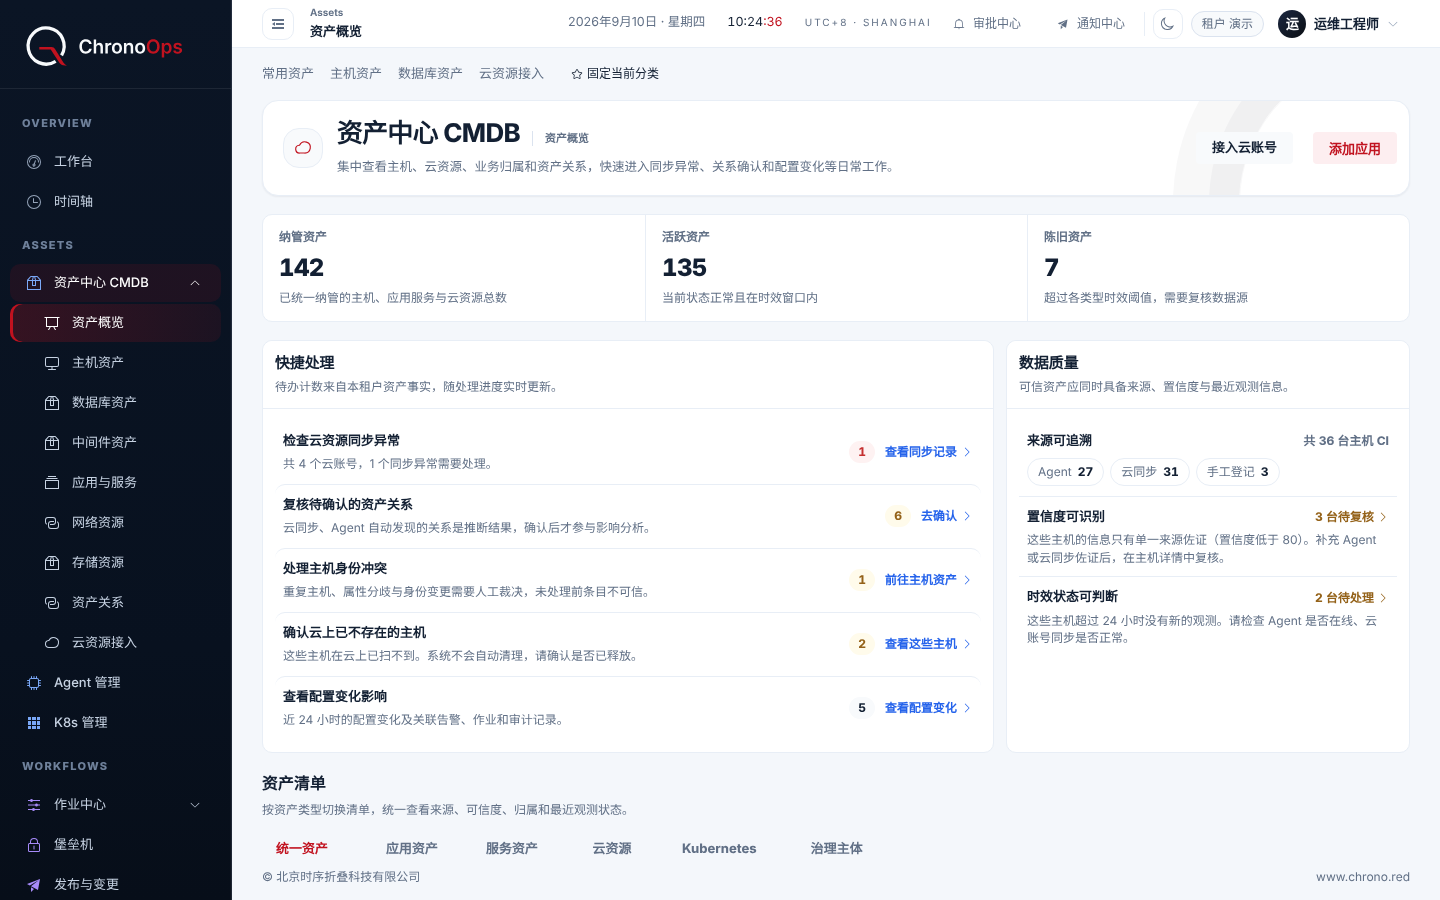
The overview opens with managed, active and stale asset counts: 142, 135 and 7 in this synthetic data. Host sources are counted separately by Agent, cloud sync and manual entry.
12
1Total managed assets, covering hosts, application services and cloud resources
2Quick actions with to-do counts for cloud sync failures, asset relations awaiting review and host identity conflicts
Screens show the current Chinese product UI with synthetic data. Open original image
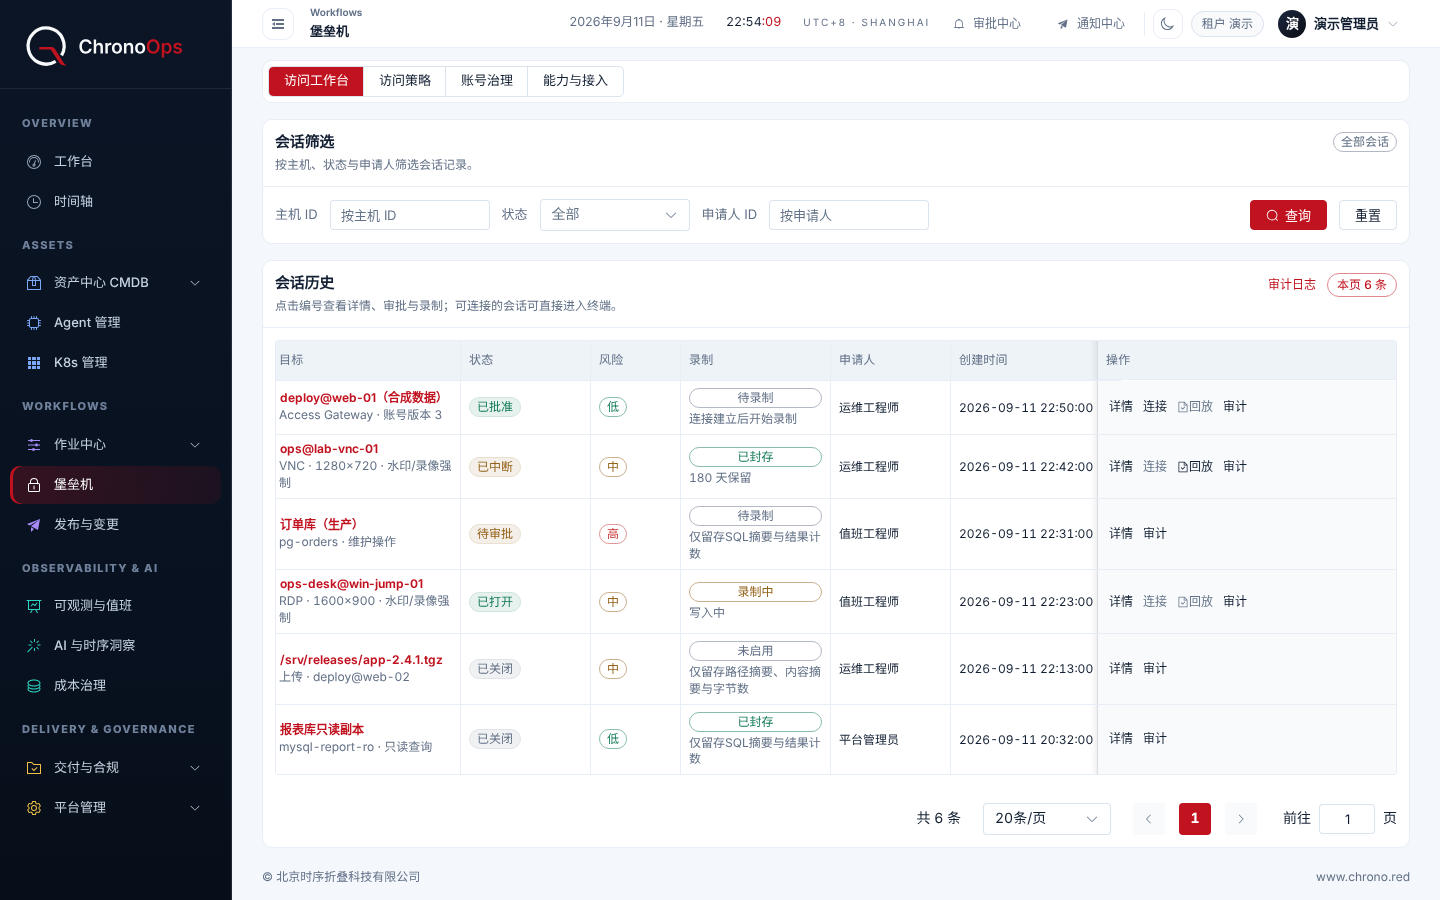
The access workspace lists six sessions, each with its target, session status, risk level and recording status; some can also be connected to and replayed.
12
1Each session's target, session status, risk level and recording status
2Details, connect, replay and audit links for sessions
Screens show the current Chinese product UI with synthetic data. Open original image
See build, deployment and latest release by service
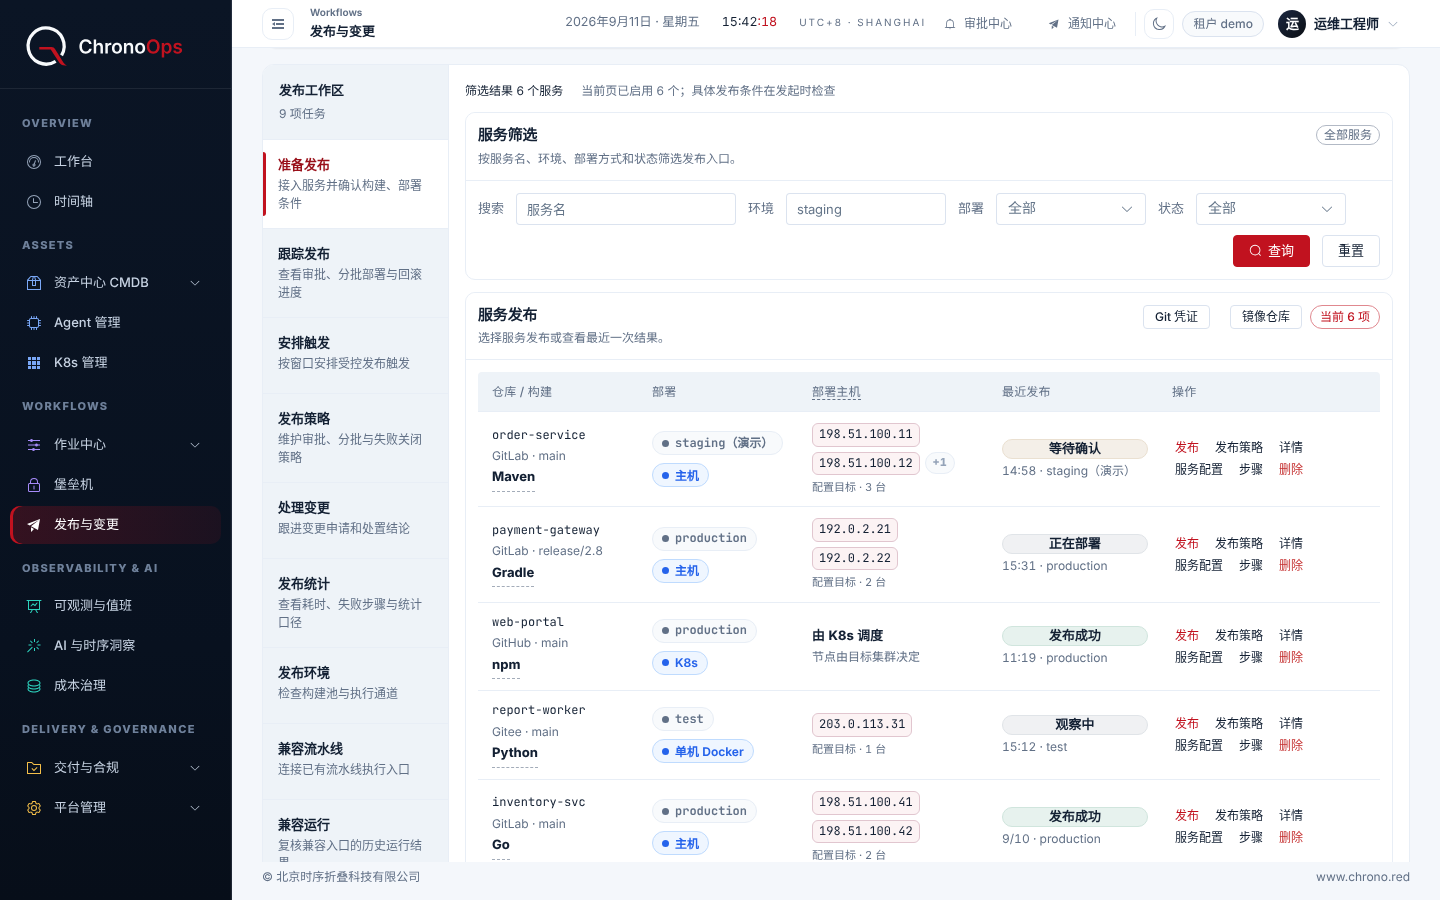
The table lists, per service, the repository and build tool, the deployment environment, the target hosts and the latest release status; the first three rows read waiting for confirmation, deploying and succeeded.
12
1Release workspace task list with Prepare release selected
2Repository and build tool, environment, target hosts and latest release status for the first two services
Screens show the current Chinese product UI with synthetic data. Open original image
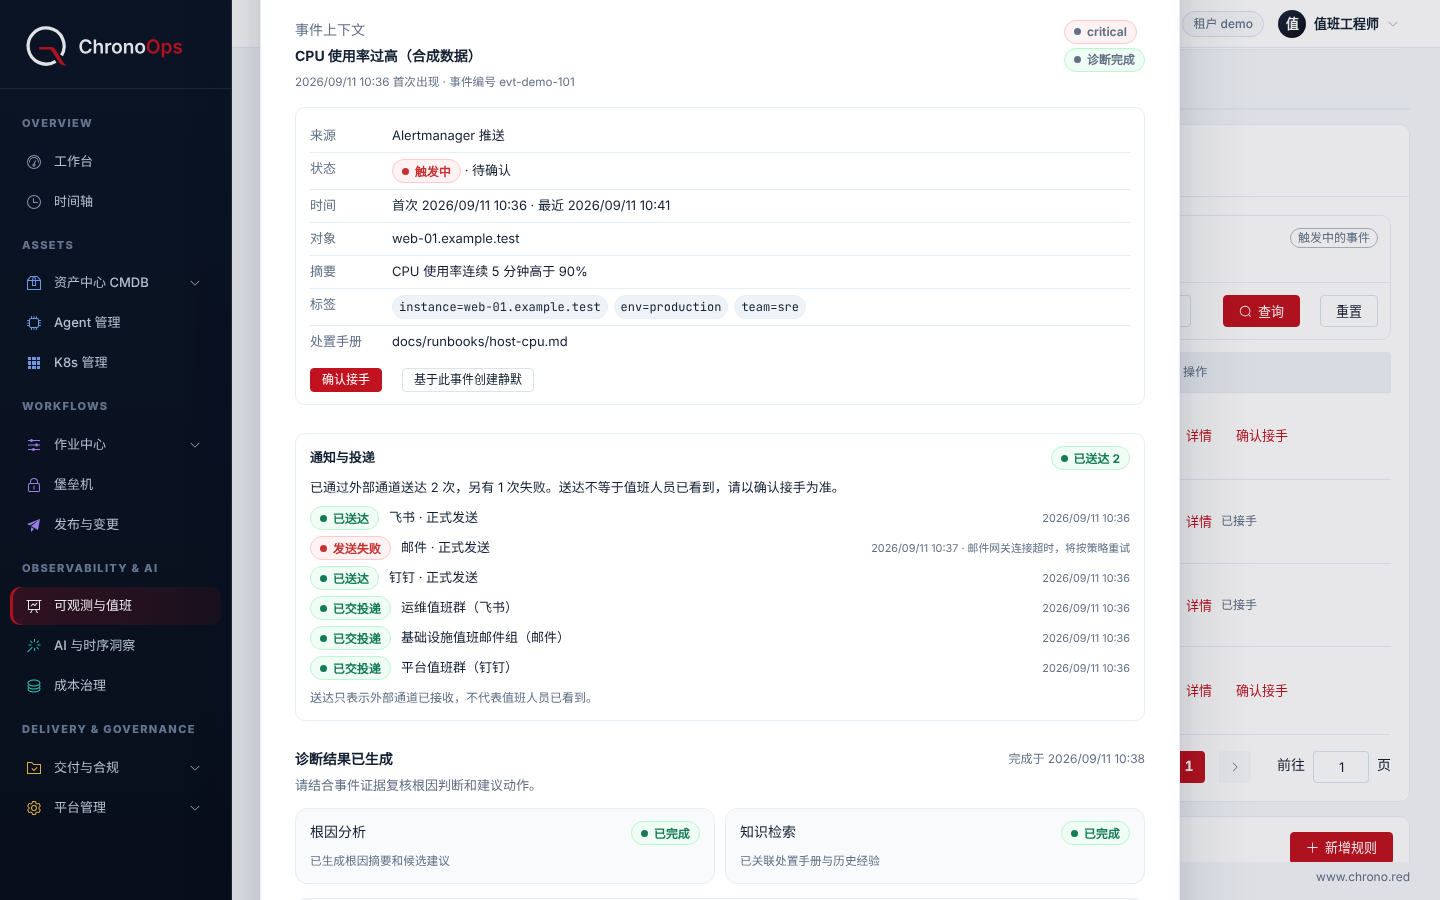
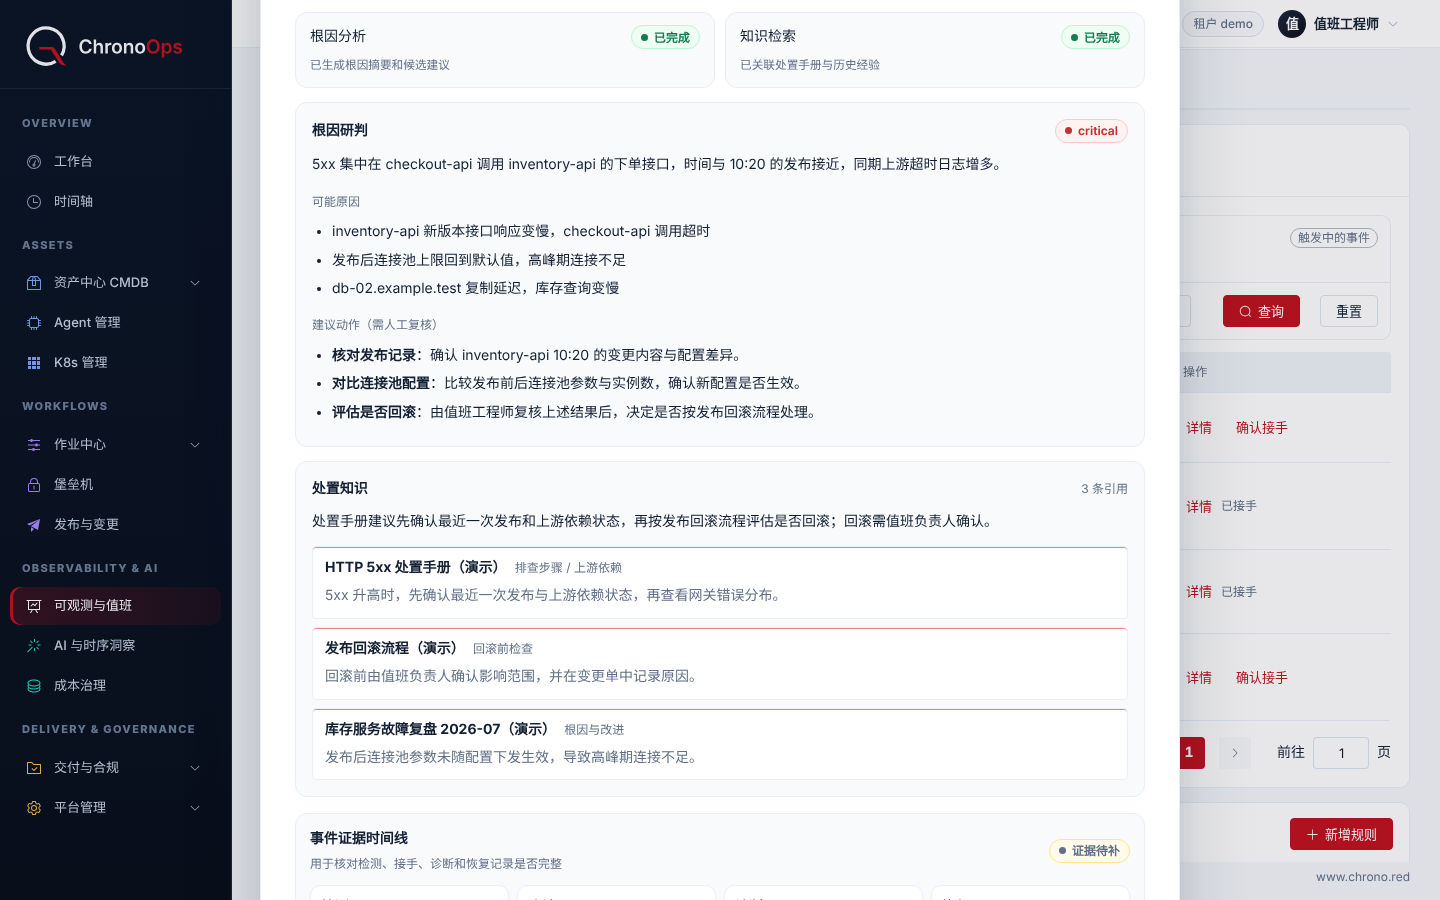
The diagnosis record of one alert event. The AI lists possible causes and marks every suggested action as needing human review; the runbook-knowledge card answers with three knowledge-base citations.
12
1AI root-cause analysis: possible causes and suggested actions that need human review
2Runbook knowledge: an answer with citations from knowledge-base documents
Screens show the current Chinese product UI with synthetic data. Open original image
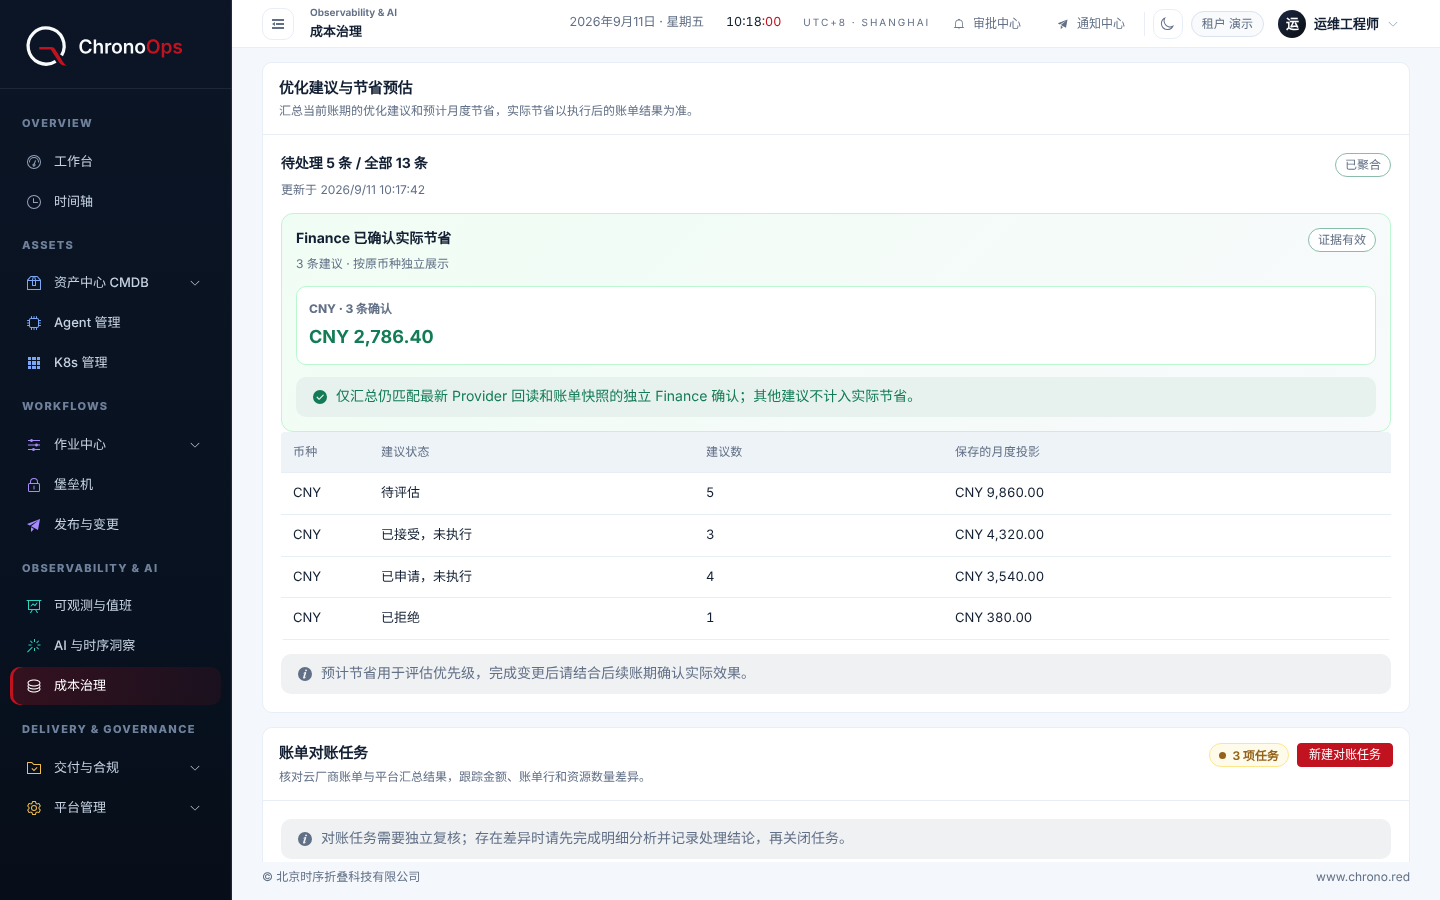
The Cloud costs page's savings panel shows realized savings confirmed by Finance on their own at the top; estimated monthly savings come below, split by recommendation status.
12
1Realized savings confirmed by Finance, shown on their own: 3 recommendations, CNY 2,786.40
2Estimated monthly savings, listed by recommendation status
Screens show the current Chinese product UI with synthetic data. Open original image
Key actions leave an audit record, exportable by time range, up to 10,000 rows at a time.
Assets
Assets & CMDB
Connect cloud accounts on AWS, Azure, Google Cloud, Alibaba Cloud, Tencent Cloud, Huawei Cloud, Volcengine and OpenStack; those resources sit in one inventory with your hosts, databases and applications. Each record carries the project it belongs to and what it relates to, and links to the matching diagnosis or operation page.
Cloud connections / Relationships / Database inventoryRead the guide
Kubernetes
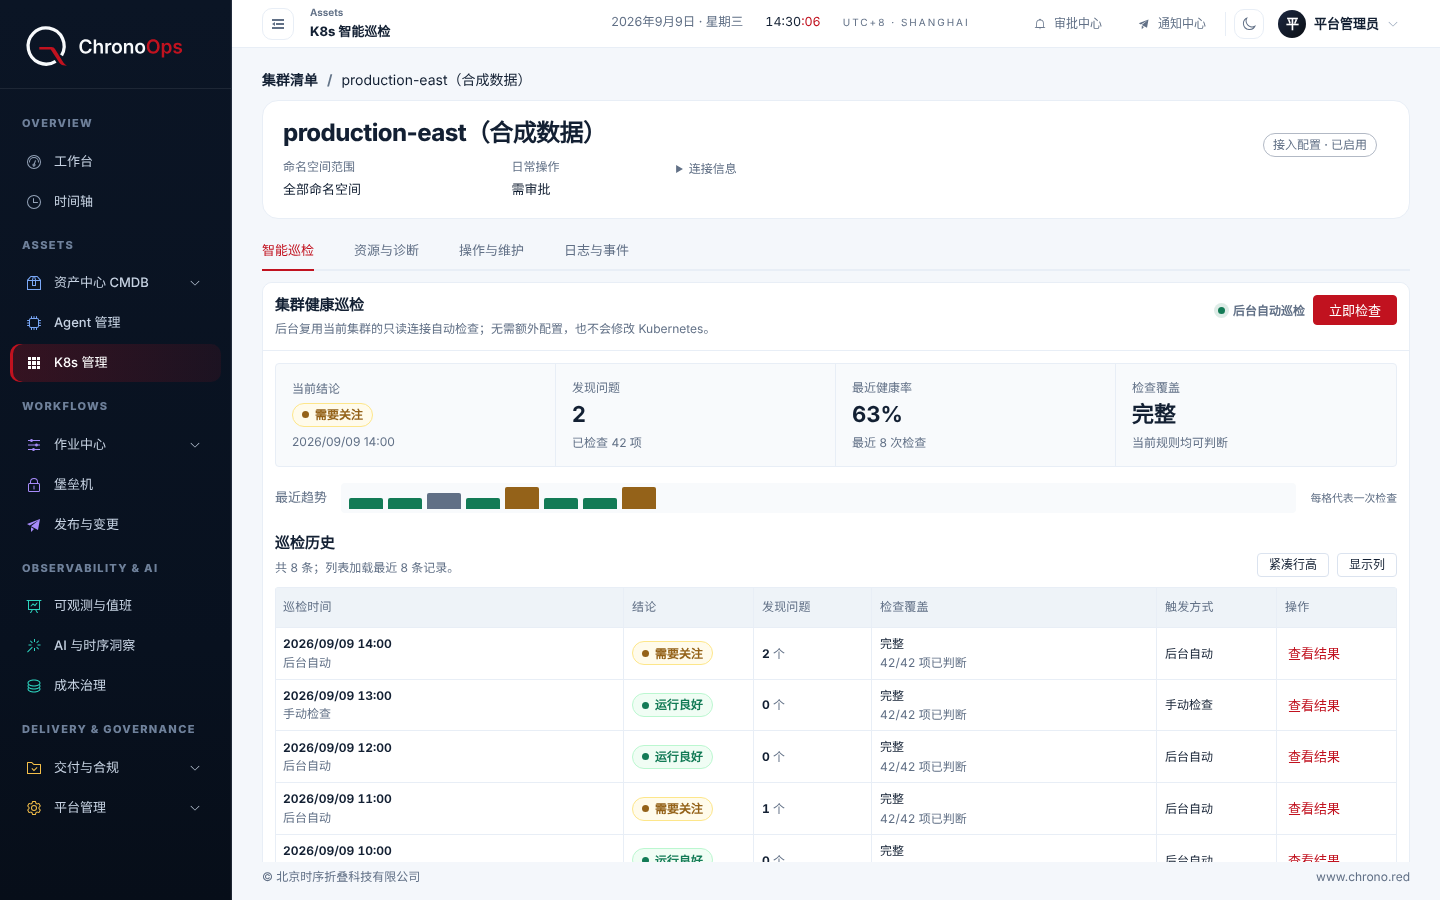
Resource status, Pod logs and events for clusters, namespaces and workloads sit in one workspace. Inspections find problems on their own, and the day-to-day operations the product supports run here too.
Resources and logs / Inspections / OperationsRead the guide
Operations
Jobs
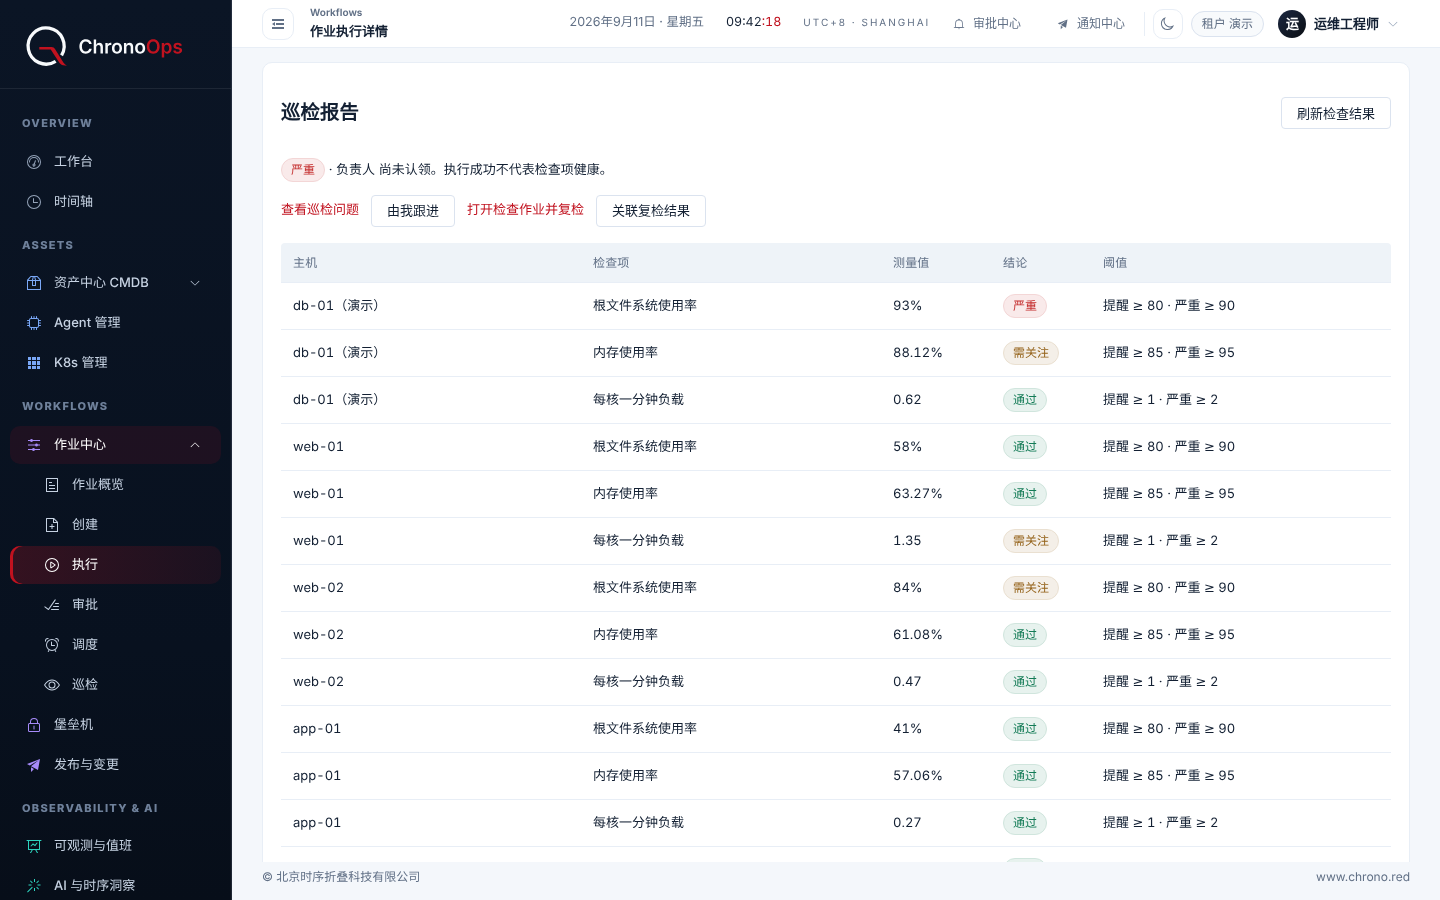
Reuse reviewed scripts and templates for batch jobs and scheduled inspections. An approval covers one run and expires after 30 minutes by default. A finding gets an owner, a record of the follow-up and a re-check.
Scripts and templates / Scheduling / ReportsRead the guide
Bastion
Connect through ChronoTerminal, managed SSH, file transfer and remote desktops. Accounts, access and session records are managed together, and recordings expire after 30 days by default.
Builds, releases and change history are organized by application and service. Follow a task, check what it did, and roll back where a rollback operation exists.
Service onboarding / Builds and releases / HistoryRead the guide
Observability and AI
Observability & on-call
Alerts come from monitoring you already run, Prometheus Alertmanager and others, routed by label to Feishu, DingTalk or email. The event page shows whether each notification got through. Rosters, overrides, escalation, silences and maintenance windows are all there. An on-call engineer acknowledges in the platform and can work against the unified timeline of recent jobs, releases and bastion sessions.
ChronoOps does not rebuild your monitoring or replace phone and SMS paging tools.
Alertmanager / Rosters and escalation / TimelineRead the guide
AI diagnosis
For an alert event it suggests likely causes and next steps, quoting your knowledge base where there is a match. Every conclusion from a process sample cites the facts collected and says what cannot be determined. Suggestions are read-only: nothing changes production on its own.
Included in Community and Enterprise. Connect a model service first, such as an enterprise model gateway or private model. Alert-event diagnosis works on alerts received through Observability & on-call.
Alert events / Process samples / Read-onlyRead the guide
Cloud costs
Public-cloud bills come together in one place, with costs, budgets and recommendations broken out by project and resource. Estimated savings stay apart from what a later billing period confirms.
Runs in your environment, with private-network and offline delivery. Localized-stack adaptation covers domestic operating systems, chip architectures and databases; the combinations are confirmed for the target release and environment.
AI assists troubleshooting You authorize the action
Alert events arrive through Observability & on-call. AI suggests likely causes and next steps, quoting your knowledge base where it matches. For process samples it cites only the facts collected and marks what it cannot determine. Execution still needs permission checks and approval under your team’s rules; an AI-generated remediation plan needs at least two different approvers.
Process diagnoses show their evidence, and say what is missing
In both editions. It works once you connect a model service — an enterprise gateway or a private model
Turn the scripts you keep rerunning into templates and run them across the targets you pick. An inspection finding gets an owner and stays tracked through its follow-up check.
Put your asset records next to the cloud bill, read costs by project and resource, then read the recommendations. Whether anything was saved, later bills tell you.
Do we need to replace our monitoring, logging or ITSM?
No. ChronoOps plugs into the monitoring, logging and other operations systems you already run, so troubleshooting shows the related assets, alerts and changes. What to connect and how depends on your data sources, permissions and network; we settle that in the demo.
Does every action need approval? Can one person use it?
No. Routine remote access proceeds once multi-factor authentication passes; a trusted device skips the MFA prompt at login for 7 days, but sensitive actions such as remote access verify again. What needs confirmation or approval follows its risk and your team’s policy; a job approval is single-use, 30 minutes by default. One person can run it alone, with the rules set at deployment.
Will AI make changes to production on its own?
No. AI analyzes the problem and proposes a fix; carrying it out is a separate step that needs the relevant access, a user authorization and your team’s operating rules, and an AI-generated remediation plan takes at least two distinct approvers. Asset management, jobs and inspections work with no model service connected.
Can we deploy on a private network or offline?
Private deployment is supported, and delivery can be offline. Backend and frontend images are built for linux/amd64 and linux/arm64; the host agent is a binary, built for linux/amd64, linux/arm64 and windows/amd64. Operating systems, chip architectures, databases, external integrations and localized-stack environments are assessed item by item for your target release and environment.
Is Community Edition open source? How do we start?
Community Edition isn’t open source — you get free licensed packages. One tenant, up to 50 managed nodes, one Kubernetes cluster, and AI diagnosis as soon as a model service is connected, whether that’s an enterprise gateway or a private model. Request a trial with the form below. For cloud costs or other Enterprise features, just ask.
Book a demo Explore the features you need
Tell us about your environment and the features you want to see. We will prepare a relevant demo and contact you within one business day.
No production accounts or sensitive data required
Request a Community trial or discuss Enterprise
Discuss private deployment, offline and platform requirements
 From diagnosis to action